Climate
Climate affects sectors in society in a number of ways. These effects may be direct, as with heat stress, or indirect, as with infectious diseases such as malaria and meningitis.
This facility aims to explore and inform users about the climate-society relationship with an emphasis on the seasonal nature of that relationship, where appropriate.
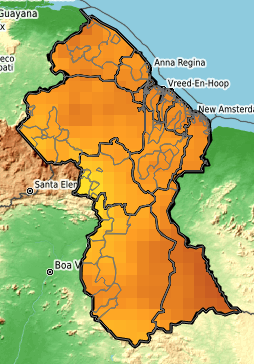
//var/parameter/(.precip)/eq/{.Rainfall}{.Temperature}ifelse/.dekadal/.c9120//var/get_parameter/interp/T/(1-10%20Sep)/VALUE//name//clim_var/def/SOURCES/.WORLDBATH/.bath/X/-61.55/-56.45/RANGE/Y/0.95/8.55/RANGE/1/index/SOURCES/.Features/.Political/.Guyana/a:/.adm2//name/%28Municipalities%29def/.the_geom/:a:/.adm1//name/%28Regions%29def/.the_geom/:a/X/Y/fig-/colors/colors/||/colors/grey/thin/stroke/black/thin/stroke/-fig//T/first/plotvalue//antialias/true/psdef//layers[//clim_var//Municipalities//Regions/]psdef//plotborder/0/psdef//antialias/true/psdef//plotaxislength/220/psdef/+.gif)


//var/parameter/(.precip)/eq/{.Rainfall}{.Temperature}ifelse/.monthly//var/get_parameter/interp/T/(Jun)//seasonStart/parameter/(-)/append/(Aug)//seasonEnd/parameter/append/(%20)/append/(1981)//YearStart/parameter/append/(-)/append/(2020)//YearEnd/parameter/append/seasonalAverage//var/get_parameter/(.precip)/eq/%7B//seasonEnd/get_parameter/interp//seasonStart/get_parameter/interp/sub/dup/0/ge/%7B1/add%7D%7B13/add%7Difelse/mul/%7Dif/T/first/VALUE/SOURCES/.Features/.Political/.Guyana/a:/.adm2//name/%28Municipalities%29def/.the_geom/:a:/.adm1//name/%28Regions%29def/.the_geom/:a/X/Y/fig-/colors/grey/thin/stroke/black/thin/stroke/-fig//plotborder/0/psdef//antialias/true/psdef//plotaxislength/220/psdef/+.gif)


//monitAna/parameter/(rainfall)/eq/{.precip}if//name/(monitAna)/def/SOURCES/.WORLDBATH/.bath/X/-61.55/-56.45/RANGE/Y/0.95/8.55/RANGE/1/index/SOURCES/.Features/.Political/.Guyana/a:/.adm2//name/%28Municipalities%29def/.the_geom/:a:/.adm1//name/%28Regions%29def/.the_geom/:a/X/Y/fig-/colors/colors/||/colors/grey/thin/stroke/black/thin/stroke/-fig//antialias/true/psdef//T/first/plotvalue//layers%5B//monitAna//Municipalities//Regions%5Dpsdef+//plotaxislength+220+psdef//plotborder+0+psdef//color_smoothing+1+psdef+.gif)
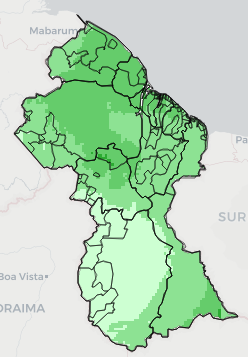
/-2/(Extremely%20Dry)/-1.6/(Severely%20Dry)/-1.3/(Moderately%20Dry)/-0.8/(Slightly%20Dry)/-0.5/(Near%20Normal)/0.5/(Slightly%20Wet)/0.8/(Moderately%20Wet)/1.3/(Severely%20Wet)/1.6/(Extremely%20Wet)/2/(Exceptionally%20Wet)/%7D/classify/%5Baprod%5Ddominant_class/startcolormap/transparent/OrangeRed/OrangeRed/brown/LightSalmon/orange/yellow/LightYellow/PaleGreen/cyan/LightSkyBlue/DodgerBlue/MediumBlue/MediumBlue/endcolormap//name//spi/def/a-/-a/SOURCES/.WORLDBATH/.bath/X/-61.55/-56.45/RANGE/Y/0.95/8.55/RANGE/1/index/SOURCES/.Features/.Political/.Guyana/a:/.adm2//name/%28Municipalities%29def/.the_geom/:a:/.adm1//name/%28Regions%29def/.the_geom/:a/X/Y/fig-/colors/colors/||/colors/grey/thin/stroke/black/thin/stroke/-fig//antialias/true/psdef//T/last/plotvalue//layers%5B//spi//Municipalities//Regions/%5Dpsdef//plotborder+0+psdef//plotaxislength+220+psdef//color_smoothing+1+psdef+.gif)
/-2/(Extremely%20Dry)/-1.6/(Severely%20Dry)/-1.3/(Moderately%20Dry)/-0.8/(Slightly%20Dry)/-0.5/(Near%20Normal)/0.5/(Slightly%20Wet)/0.8/(Moderately%20Wet)/1.3/(Severely%20Wet)/1.6/(Extremely%20Wet)/2/(Exceptionally%20Wet)/%7D/classify/%5Baprod%5Ddominant_class/startcolormap/transparent/OrangeRed/OrangeRed/brown/LightSalmon/orange/yellow/LightYellow/PaleGreen/cyan/LightSkyBlue/DodgerBlue/MediumBlue/MediumBlue/endcolormap//name//spi/def/a-/-a/SOURCES/.WORLDBATH/.bath/X/-61.55/-56.45/RANGE/Y/0.95/8.55/RANGE/1/index/SOURCES/.Features/.Political/.Guyana/a:/.adm2//name/%28Municipalities%29def/.the_geom/:a:/.adm1//name/%28Regions%29def/.the_geom/:a/X/Y/fig-/colors/colors/||/colors/grey/thin/stroke/black/thin/stroke/-fig//antialias/true/psdef//T/last/plotvalue//layers%5B//spi//Municipalities//Regions/%5Dpsdef//plotborder+0+psdef//plotaxislength+220+psdef//color_smoothing+1+psdef+.gif)
/-2/(Extremely%20Dry)/-1.6/(Severely%20Dry)/-1.3/(Moderately%20Dry)/-0.8/(Slightly%20Dry)/-0.5/(Near%20Normal)/0.5/(Slightly%20Wet)/0.8/(Moderately%20Wet)/1.3/(Severely%20Wet)/1.6/(Extremely%20Wet)/2/(Exceptionally%20Wet)/%7D/classify/%5Baprod%5Ddominant_class/startcolormap/transparent/OrangeRed/OrangeRed/brown/LightSalmon/orange/yellow/LightYellow/PaleGreen/cyan/LightSkyBlue/DodgerBlue/MediumBlue/MediumBlue/endcolormap//name//spi/def/a-/-a/SOURCES/.WORLDBATH/.bath/X/-61.55/-56.45/RANGE/Y/0.95/8.55/RANGE/1/index/SOURCES/.Features/.Political/.Guyana/a:/.adm2//name/%28Municipalities%29def/.the_geom/:a:/.adm1//name/%28Regions%29def/.the_geom/:a/X/Y/fig-/colors/colors/||/colors/grey/thin/stroke/black/thin/stroke/-fig//antialias/true/psdef//T/last/plotvalue//layers%5B//spi//Municipalities//Regions/%5Dpsdef//plotborder+0+psdef//plotaxislength+220+psdef//color_smoothing+1+psdef+.gif)
/-2/(Extremely%20Dry)/-1.6/(Severely%20Dry)/-1.3/(Moderately%20Dry)/-0.8/(Slightly%20Dry)/-0.5/(Near%20Normal)/0.5/(Slightly%20Wet)/0.8/(Moderately%20Wet)/1.3/(Severely%20Wet)/1.6/(Extremely%20Wet)/2/(Exceptionally%20Wet)/%7D/classify/%5Baprod%5Ddominant_class/startcolormap/transparent/OrangeRed/OrangeRed/brown/LightSalmon/orange/yellow/LightYellow/PaleGreen/cyan/LightSkyBlue/DodgerBlue/MediumBlue/MediumBlue/endcolormap//name//spi/def/a-/-a/SOURCES/.WORLDBATH/.bath/X/-61.55/-56.45/RANGE/Y/0.95/8.55/RANGE/1/index/SOURCES/.Features/.Political/.Guyana/a:/.adm2//name/%28Municipalities%29def/.the_geom/:a:/.adm1//name/%28Regions%29def/.the_geom/:a/X/Y/fig-/colors/colors/||/colors/grey/thin/stroke/black/thin/stroke/-fig//antialias/true/psdef//T/last/plotvalue//layers%5B//spi//Municipalities//Regions/%5Dpsdef//plotborder+0+psdef//plotaxislength+220+psdef//color_smoothing+1+psdef+.gif)